
Over the past three decades, Nepal has undergone a quiet but meaningful transformation. From the mid-1990s to today, households have seen improvements in income, education, access to services, and overall living standards. Yet, beneath this progress lies a more complex story, one where gains are unevenly shared across regions and income groups.
Using data from four rounds of the Nepal Living Standards Survey (NLSS), this story explores how far Nepal has come, who has benefited the most, and who still risks being left behind.
Trends in Poverty Incidence
Poverty in Nepal has declined markedly over the last three decades. Successive NLSS rounds show a steady reduction in the share of people living below the national poverty line, supported by growth in income, better access to basic services, and migration‑driven remittances.
The 2022-23 national poverty line for Nepal is set at Rs. 72,908 per person per year, comprising Rs. 35,029 for food (based on a 2,236 kcal daily requirement) and Rs. 37,879 for nonfood needs. According to this threshold, 20.27% of Nepal's population lives below the poverty line.
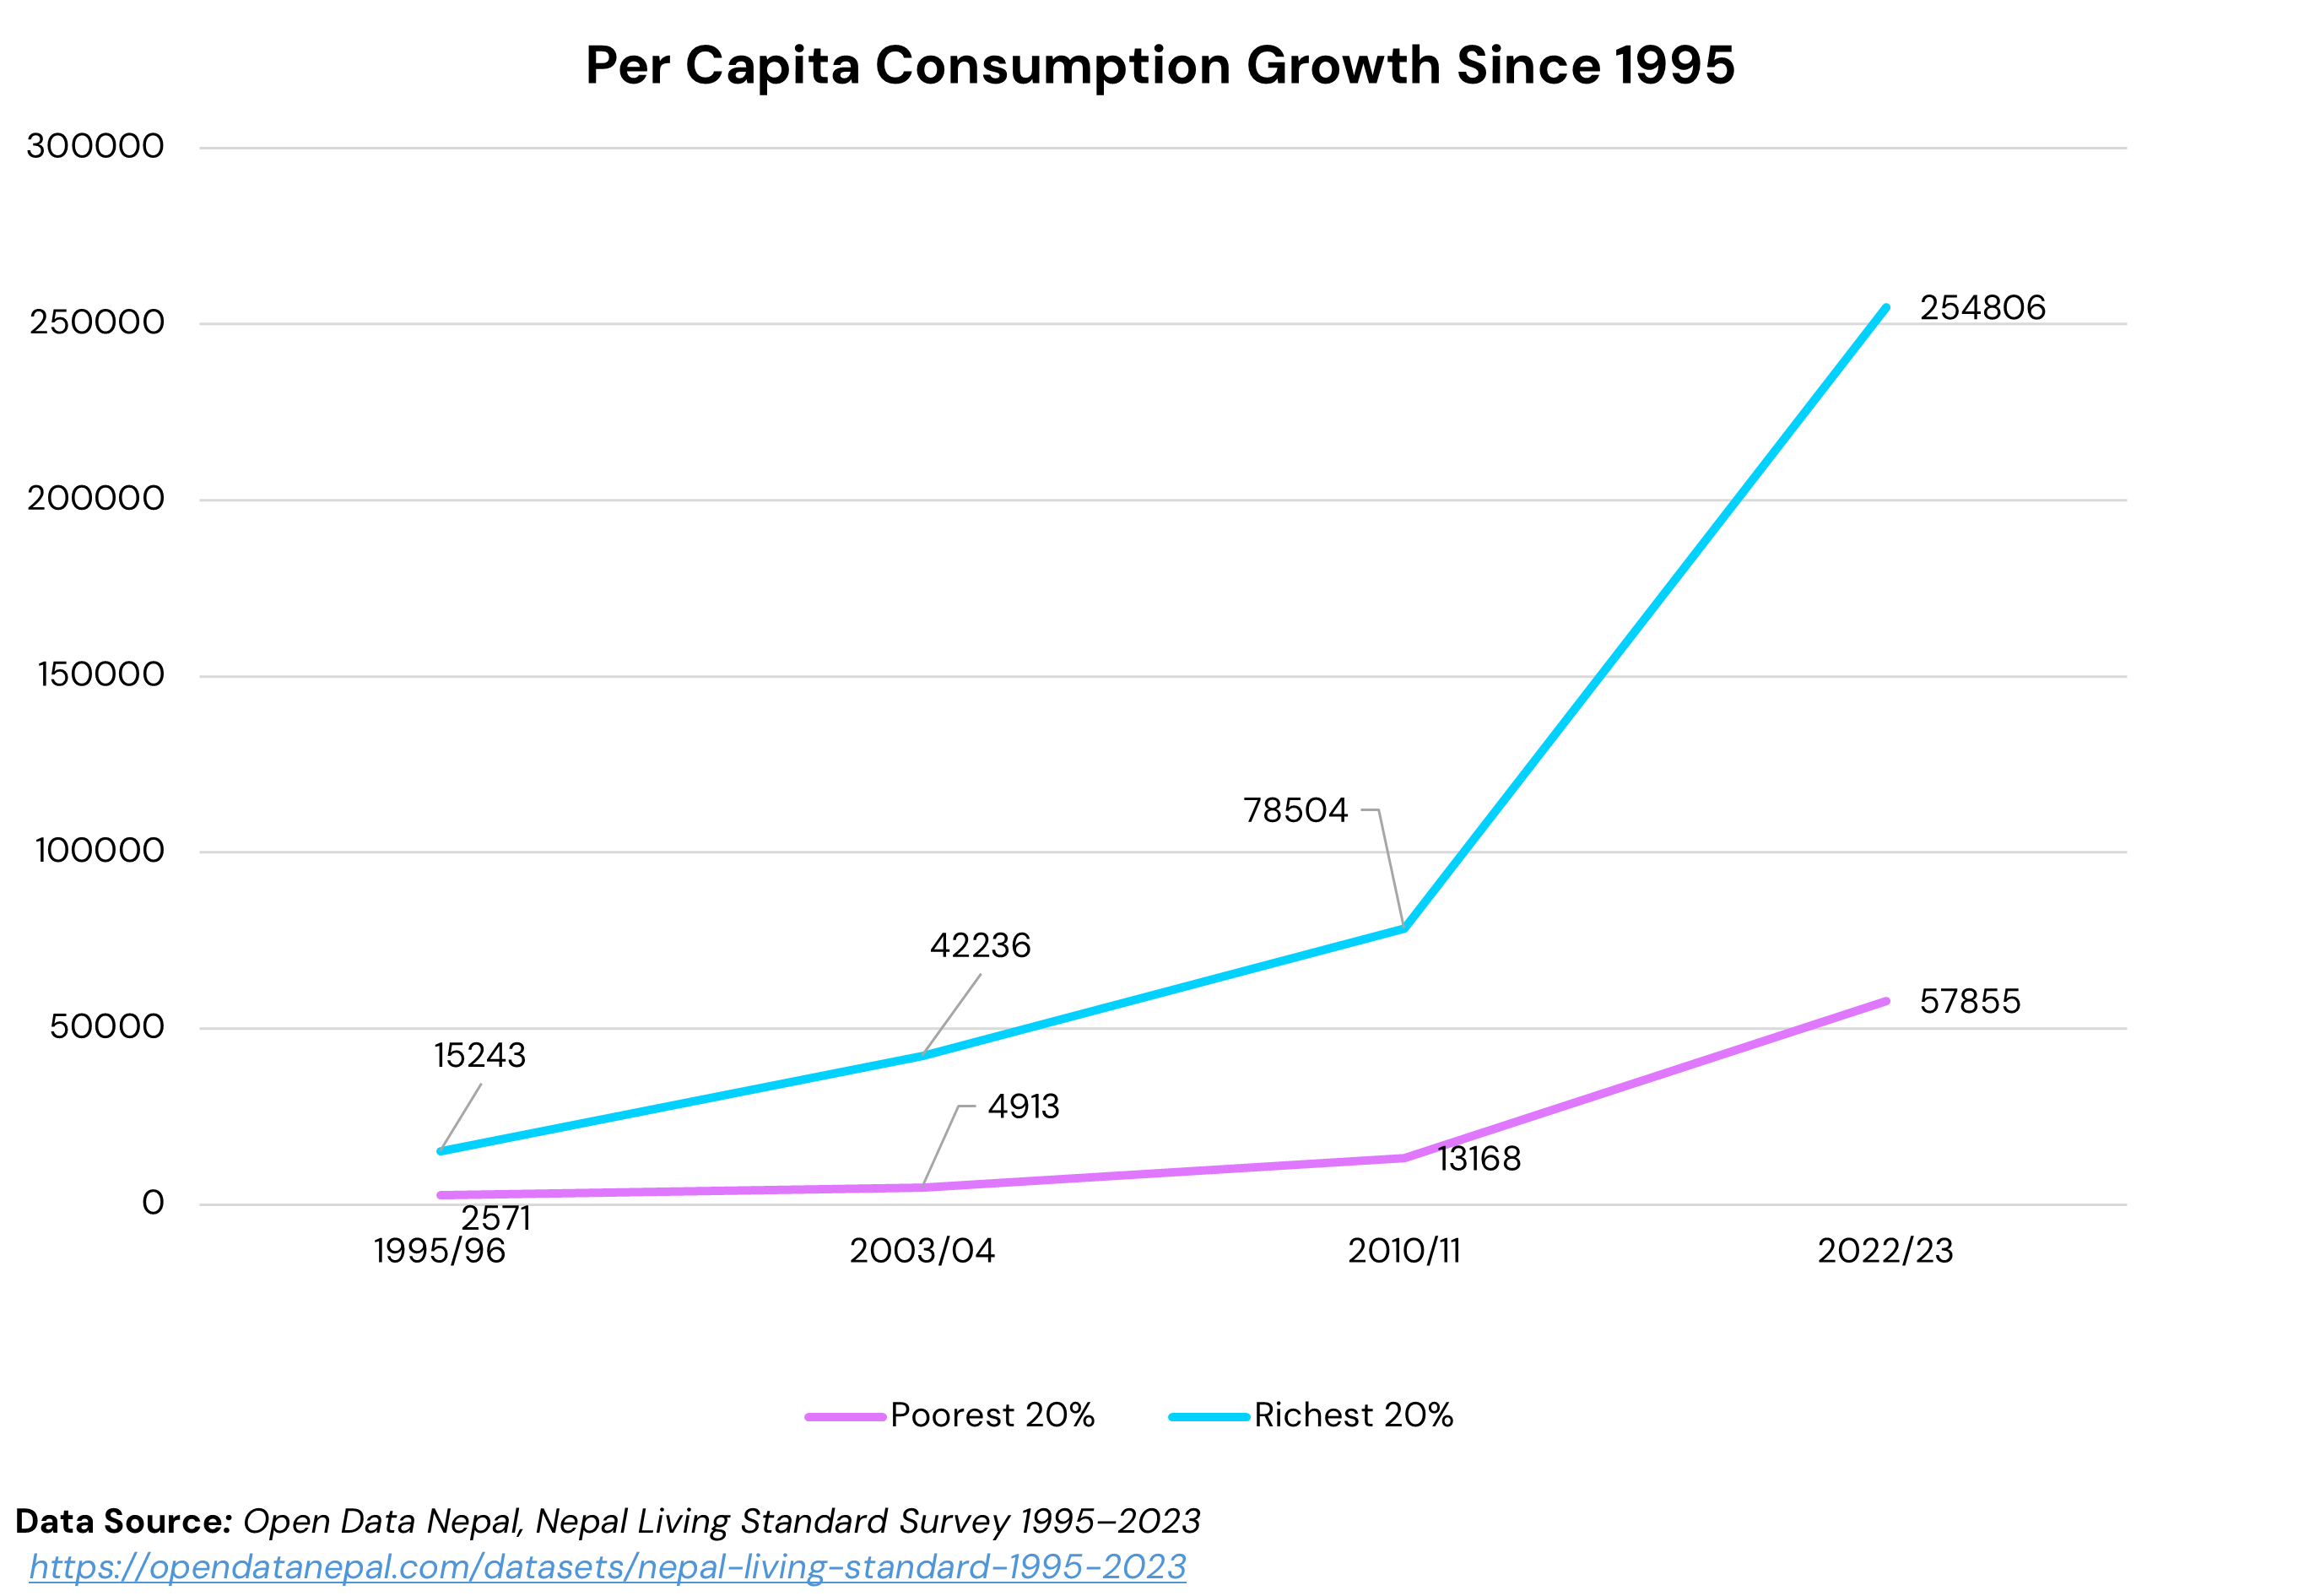
Changes in Household Income and Per Capita Consumption Since 1995
Since 1995, household income and consumption levels have increased substantially, indicating economic progress. In nominal terms, average household income rose more than twelvefold between 1995–96 and 2022–23, from Rs. 43,732 to Rs. 551,148. Per capita consumption increased from Rs. 6,802 to Rs. 130,853, while per capita income grew from Rs. 7,690 to Rs. 136,707. These figures are reported in nominal terms and do not account for inflation, meaning that part of the observed increase reflects higher prices rather than improvements in real purchasing power, and gains may differ across households and regions.
However, the data also highlights persistent income inequality, with a notable difference in consumption levels between the poorest and richest 20 percent of the population. In 2022-23, the richest 20 percent had an annual nominal per capita consumption of Rs. 254,806, while the poorest 20 percent had annual nominal per capita consumption of Rs. 57,855.
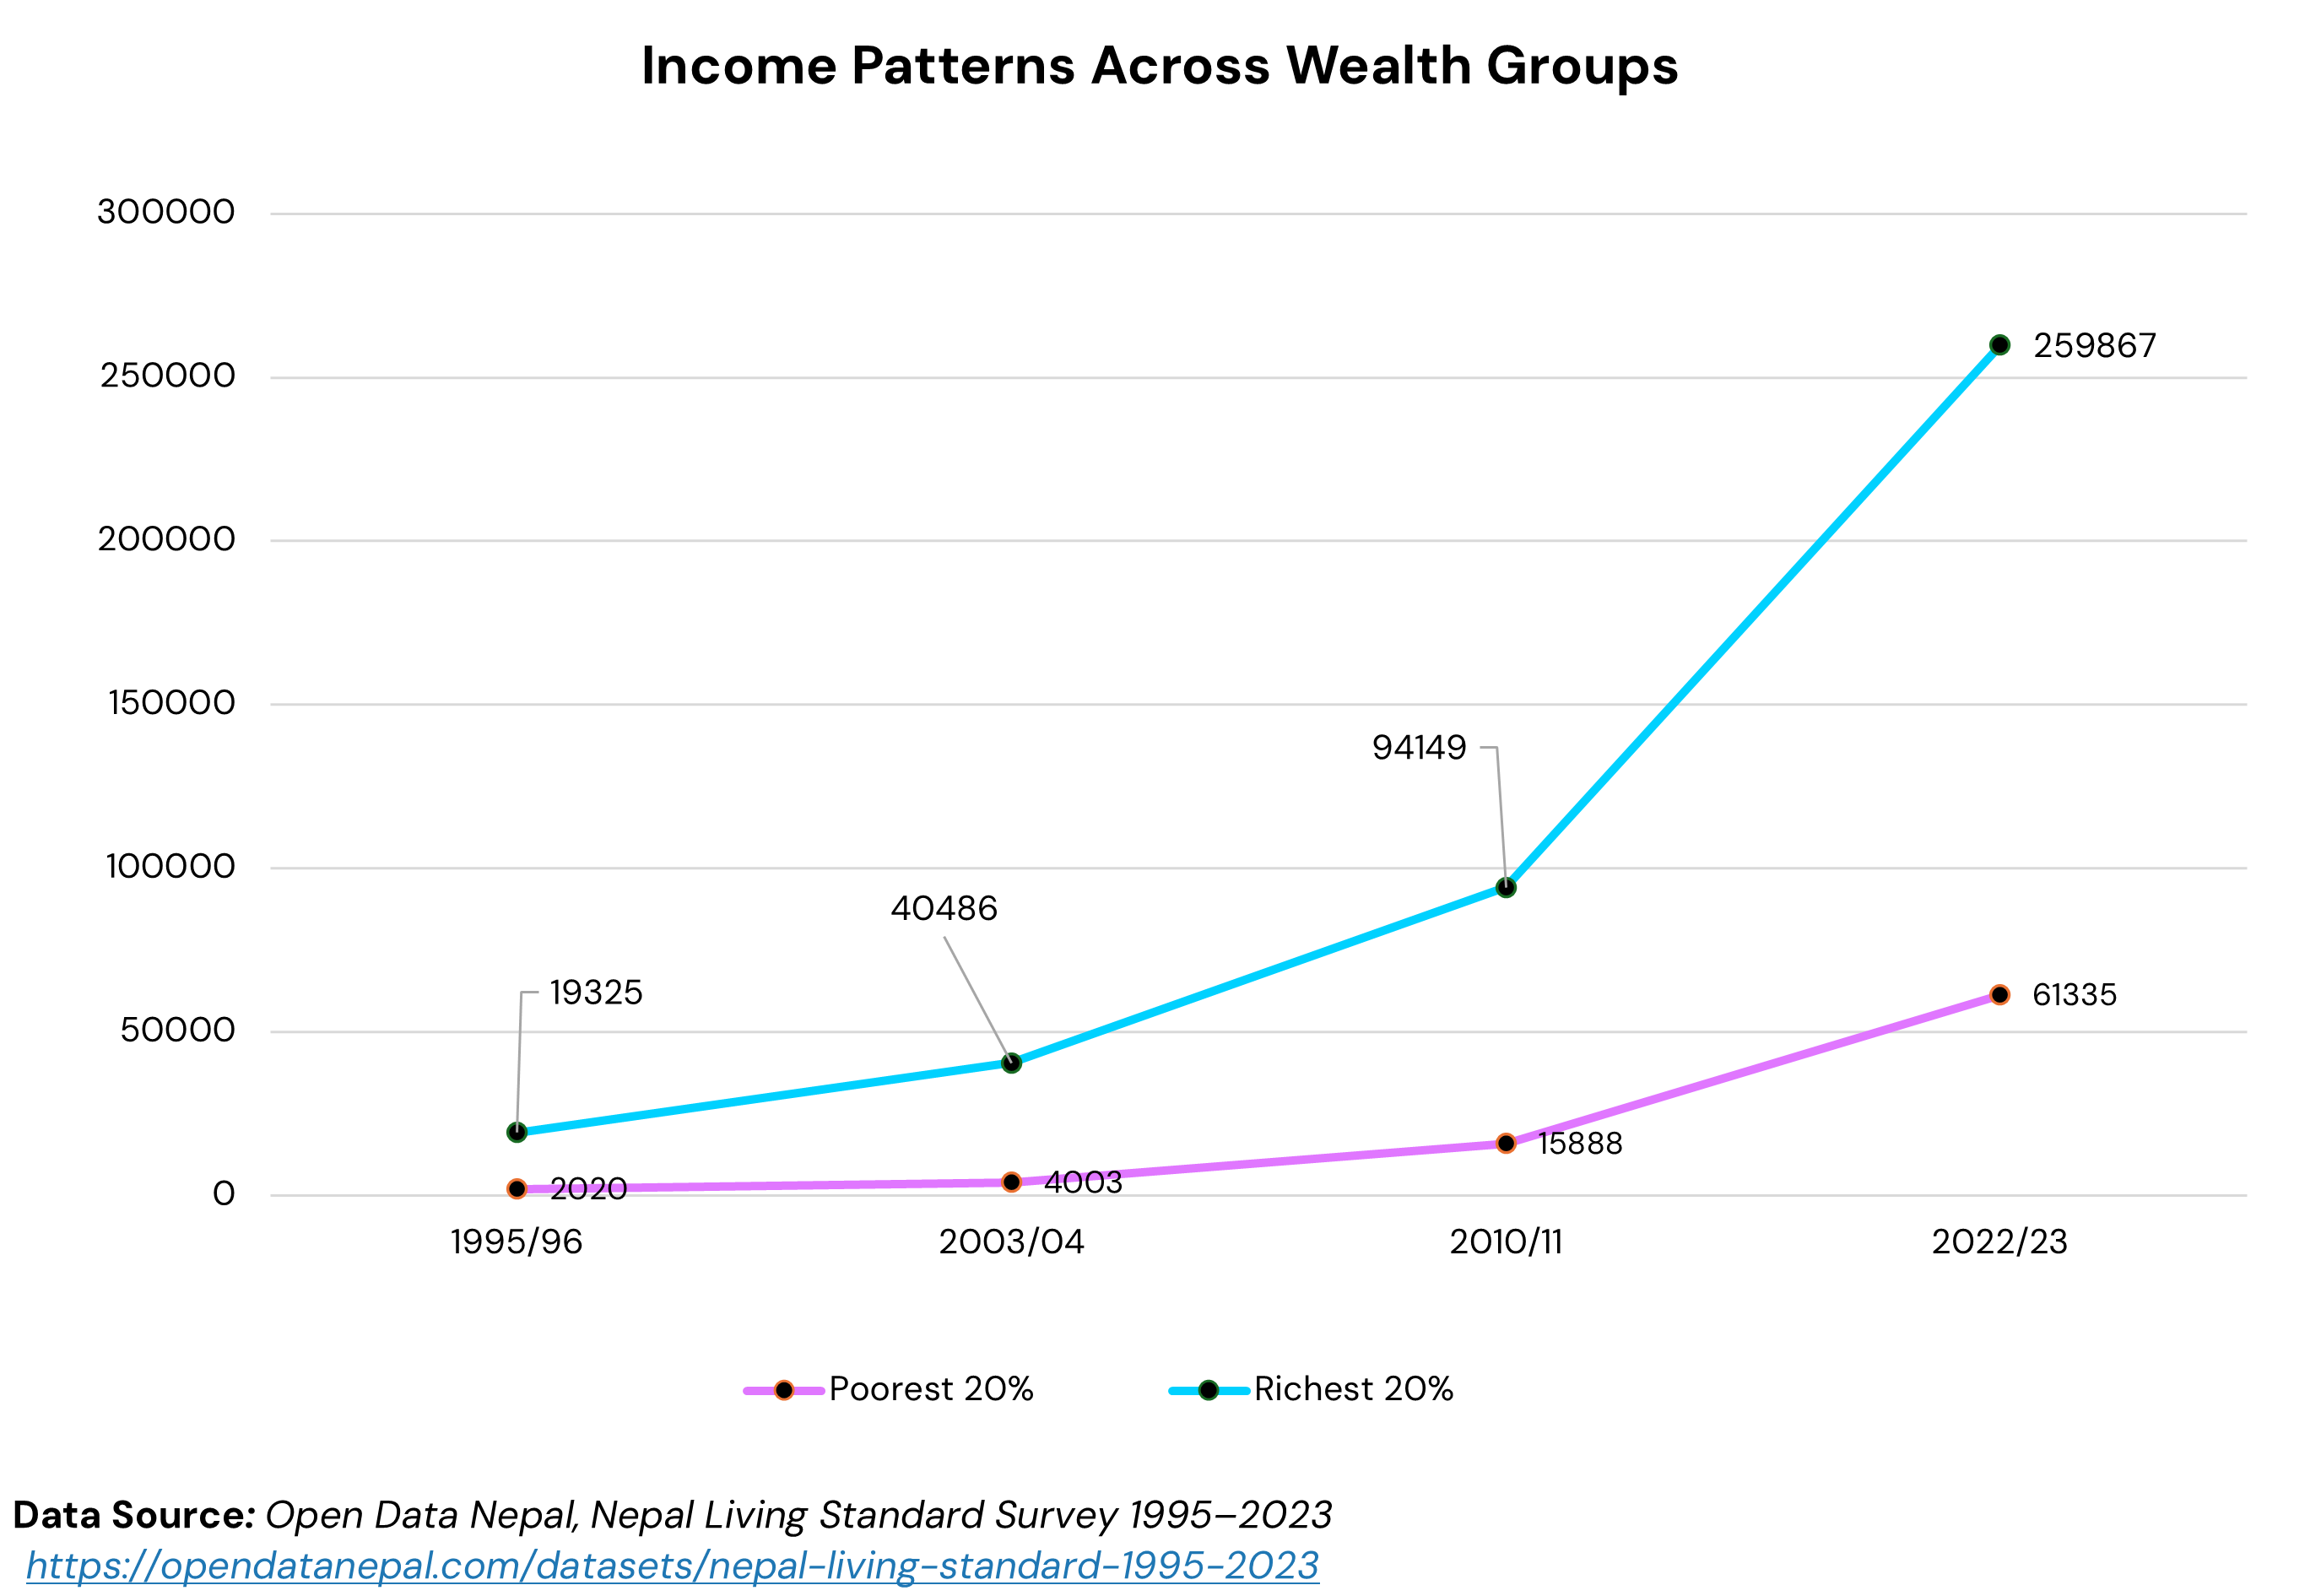
The per capita income of the poorest 20% of the population grew from NRs. 2,020 to NRs. 61,335, while that of the richest 20% surged from NRs. 19,325 to NRs. 259,867.
This gap suggests that although poverty has declined overall, inequality has widened, raising an important question: are the poorest households benefiting enough from Nepal’s economic growth?
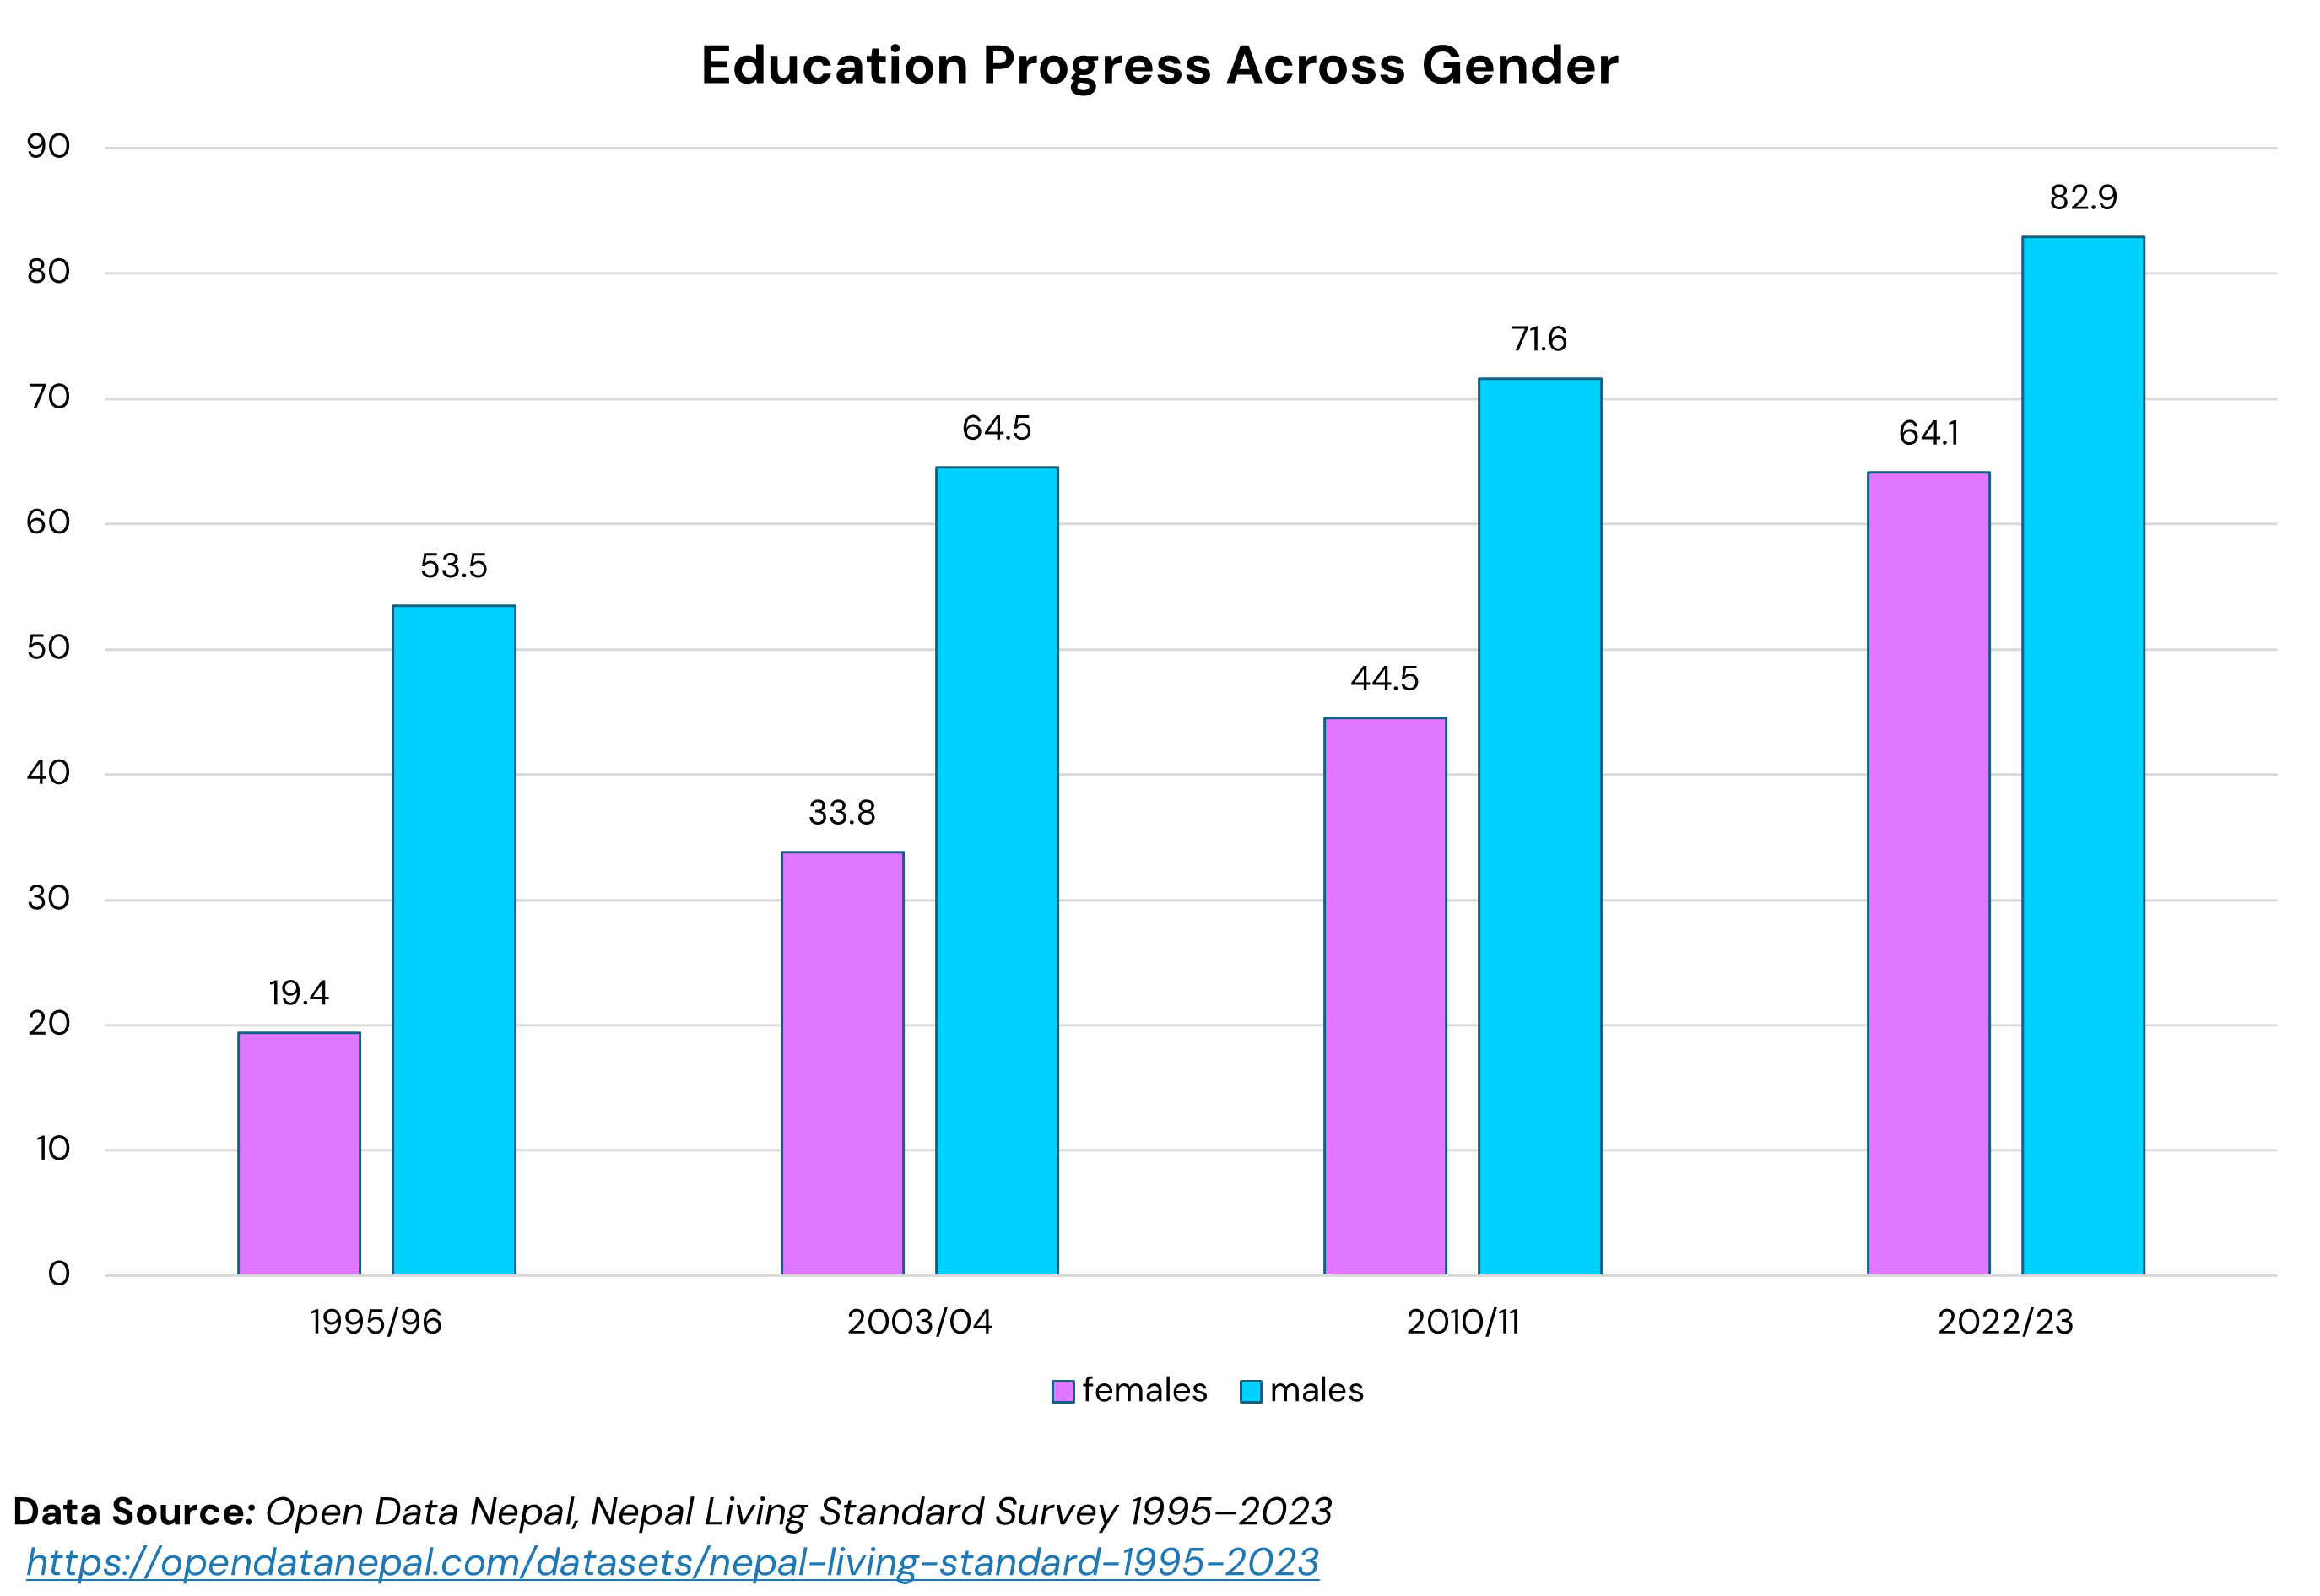
Education and Literacy: Significant Gains, Narrowing Gender Gaps
Education tells one of Nepal’s most encouraging stories. Literacy rates have risen steadily over time, reflecting expanded access to schools and greater public investment in education.
Male literacy rates have consistently been higher than female rates over the decades, but both have seen notable increases over time. Male literacy rose by 11 percent from 71.6 percent to 82.9 percent over the past decade, while female literacy gained about 20 percent rising from 44.5 percent to 64.1 percent. Despite these gains, gender disparity remains a challenge, though the gap is narrowing, indicating ongoing efforts to achieve gender parity in education.
This shift reflects changing social norms, improved school access, and growing recognition of the importance of educating girls.
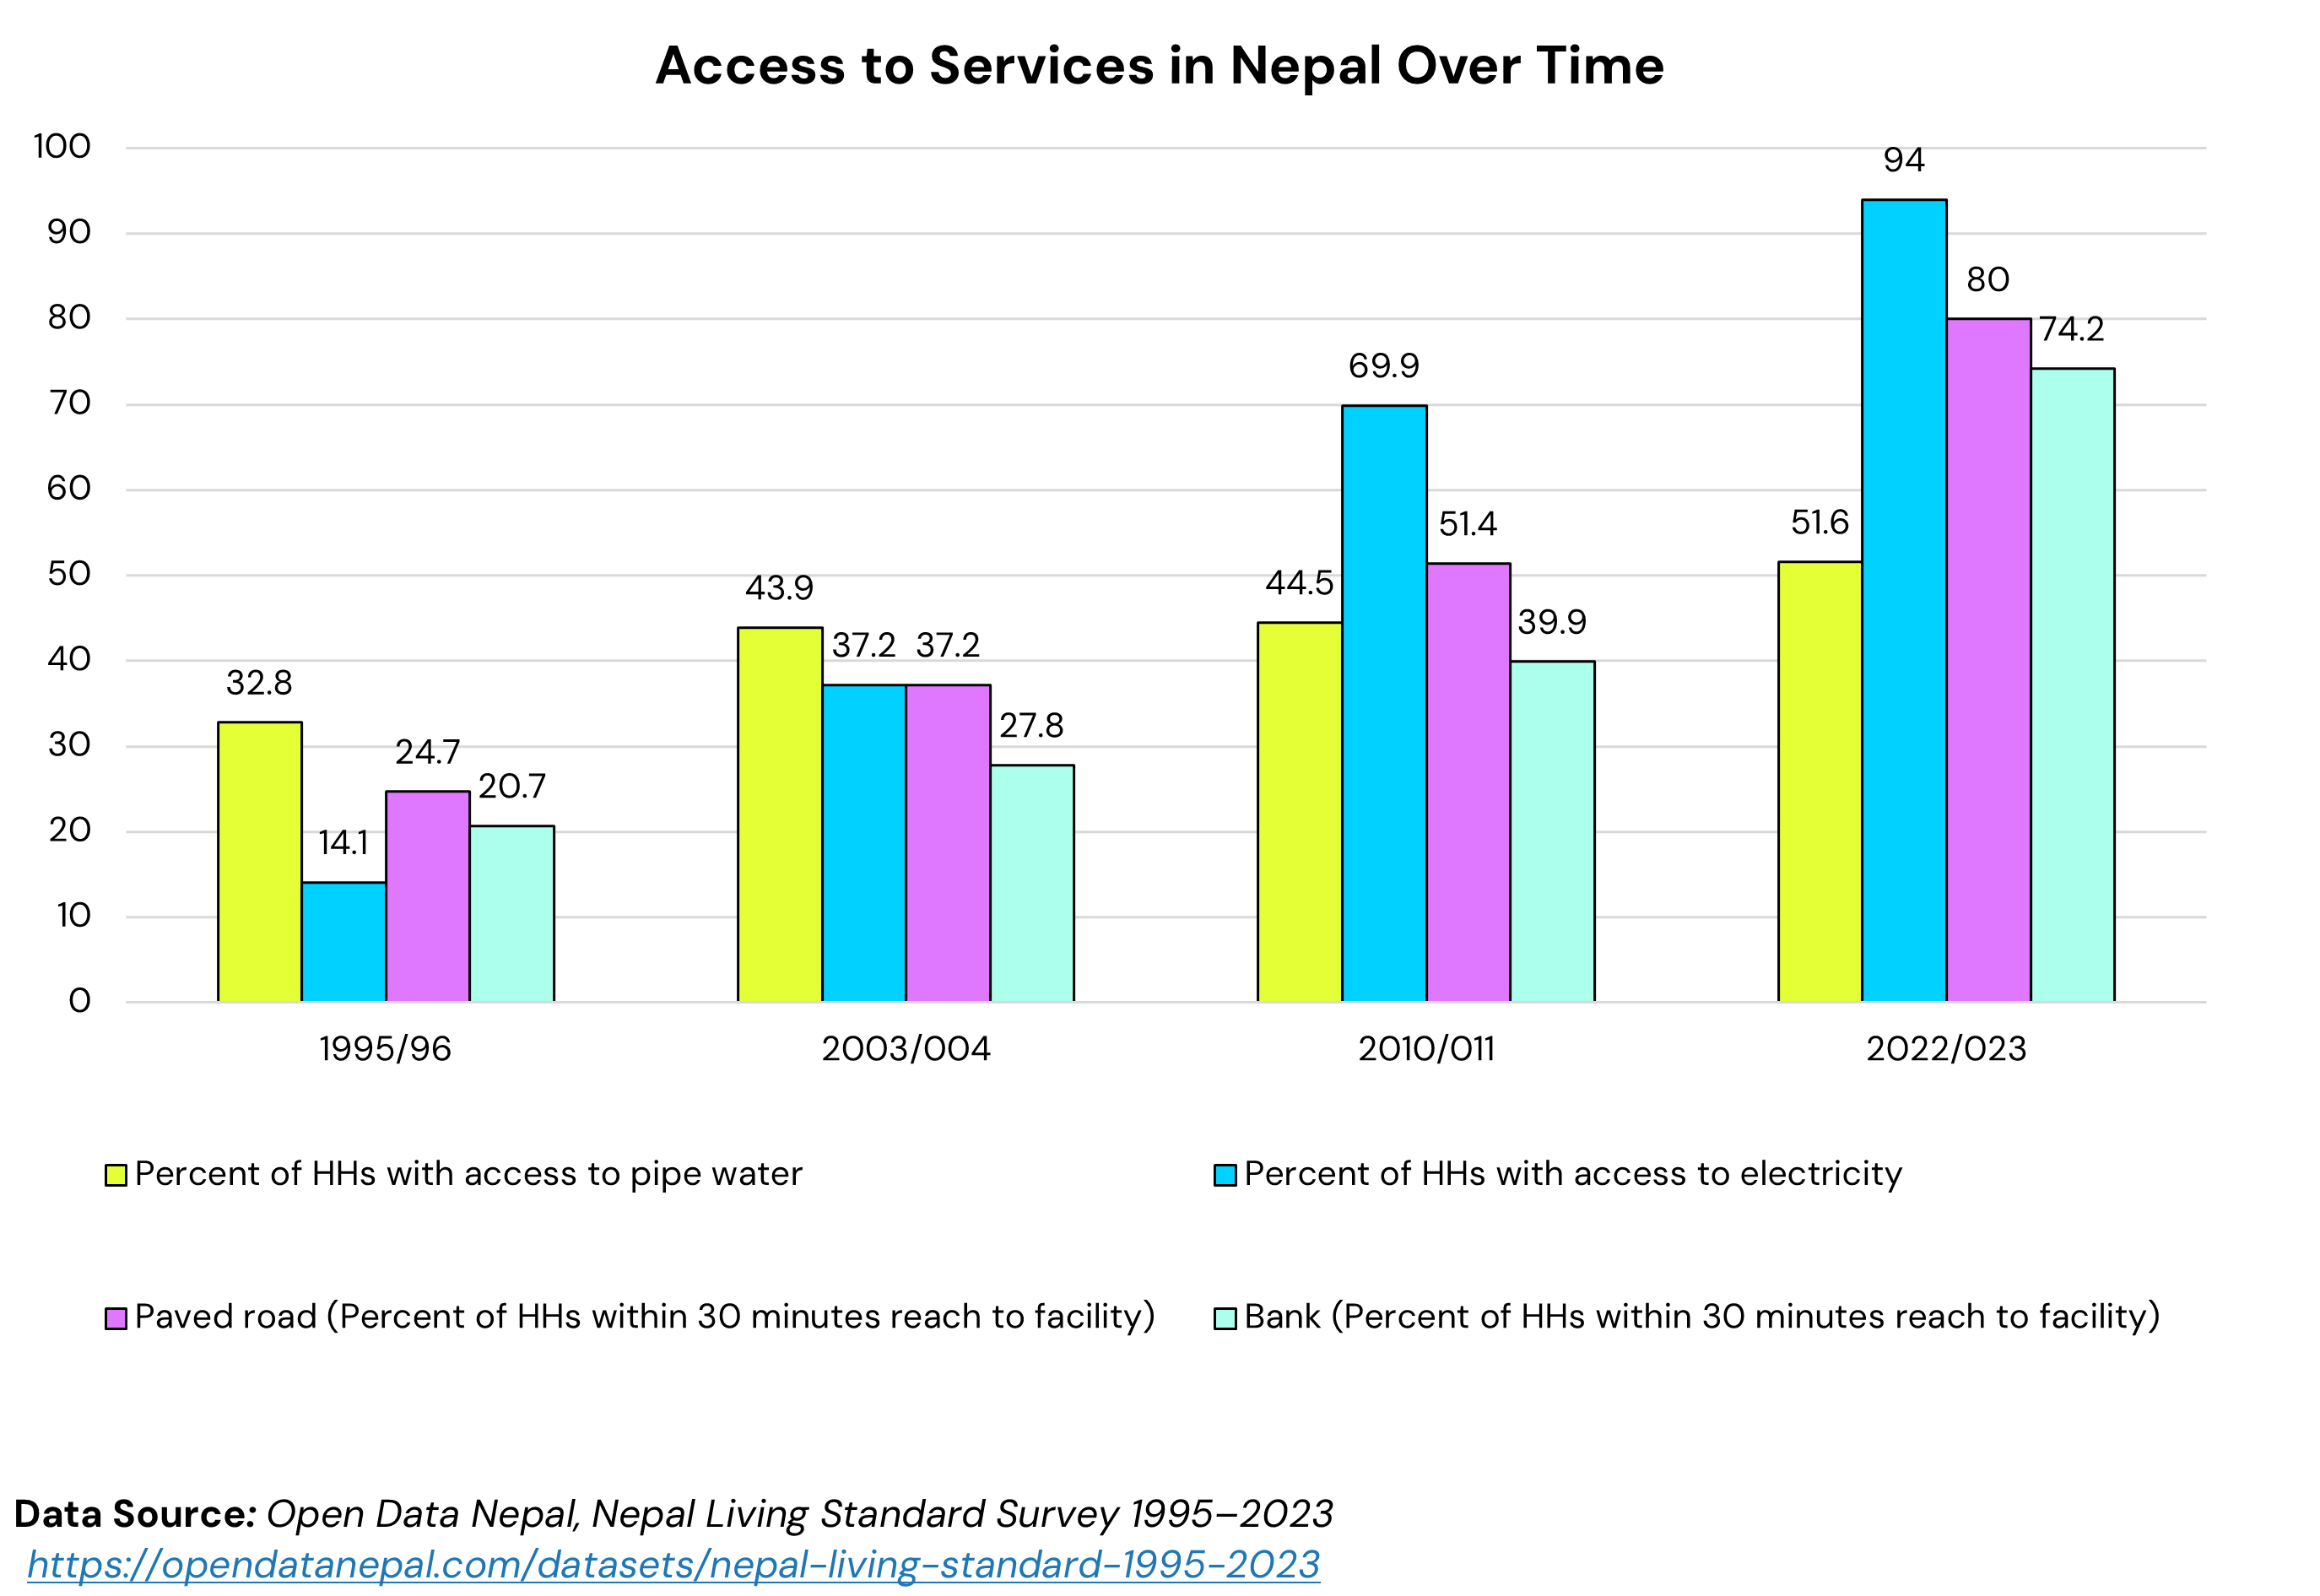
Infrastructure and Basic Services: Expanding Access Across Households
Daily life for many Nepali households has improved in tangible ways. Access to electricity, drinking water, roads, schools, and financial services has expanded dramatically since the mid-1990s.
Electricity, once a privilege for a small share of households, has become widespread, reaching the vast majority of households. Roads connect more communities than ever before, reducing isolation and improving access to markets, schools, and health facilities. Banking services have also spread widely, signaling deeper financial inclusion.
These improvements have played a crucial role in raising overall quality of life and enabling economic participation.
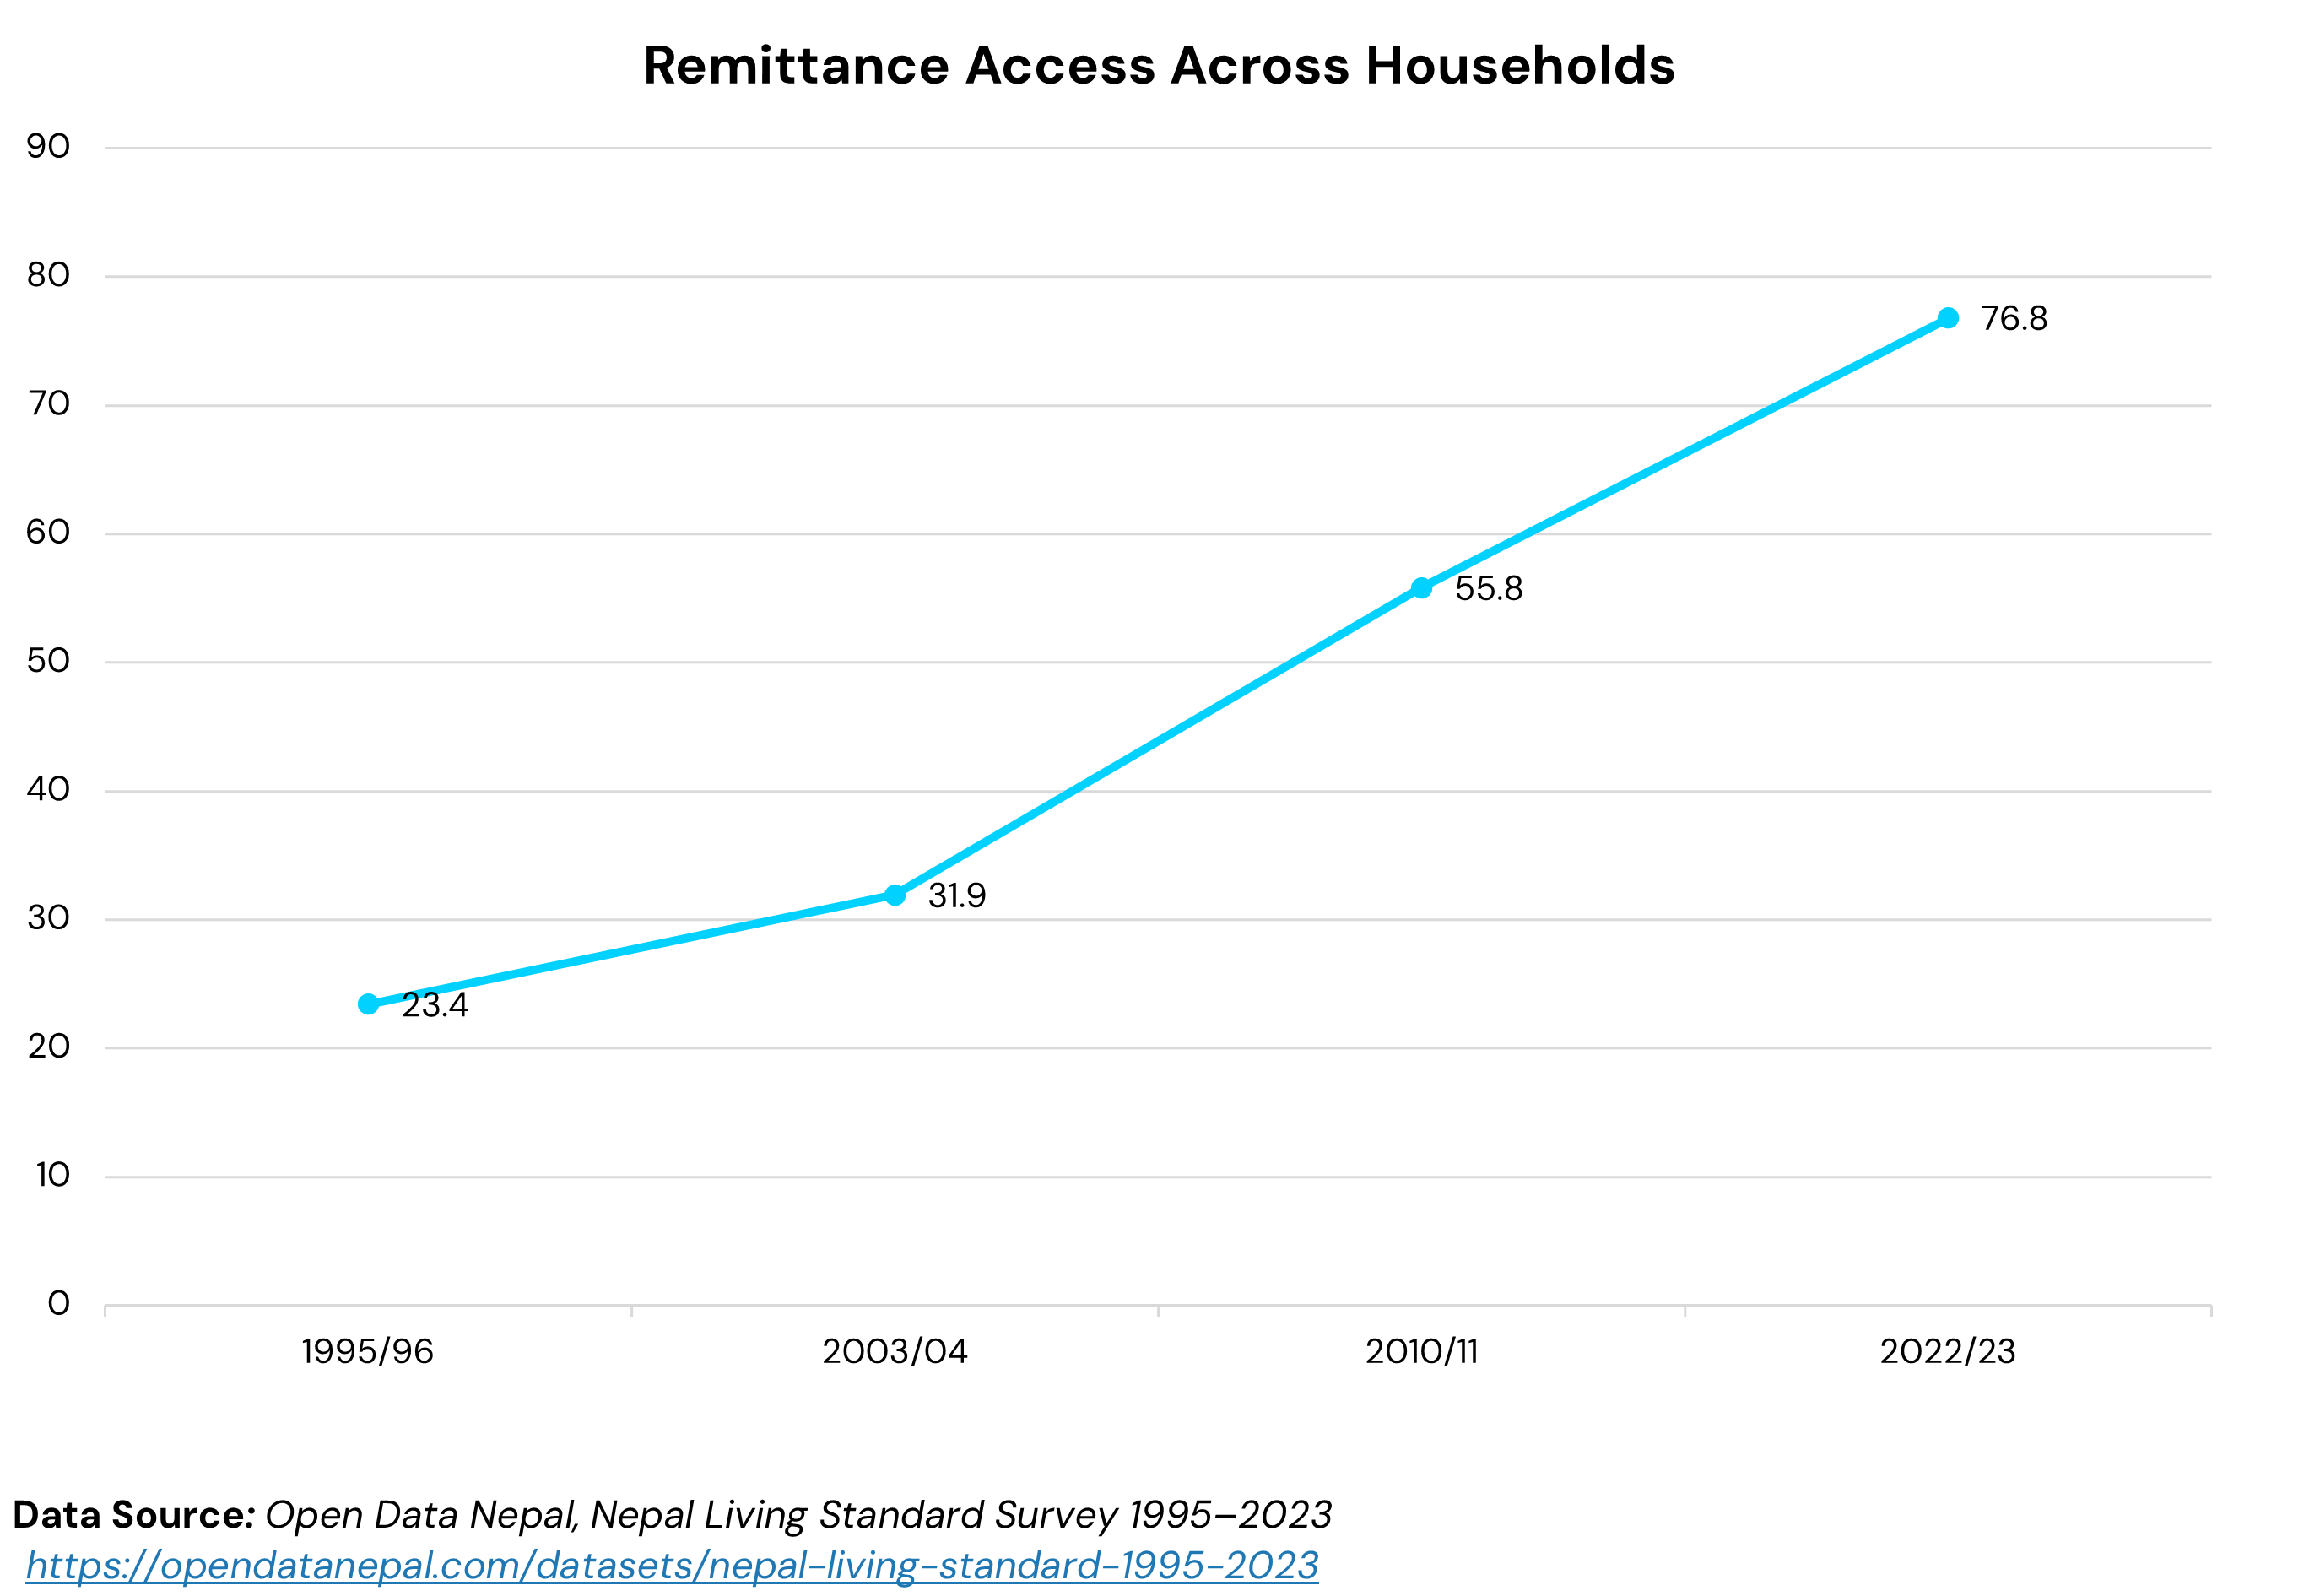
Role of Remittances in Household Income
One of the most transformative changes in Nepal’s economy has been the rise of remittances. Today, migration income touches the lives of a majority of households far more than in the 1990s.
Remittances have boosted household incomes, supported consumption, and helped reduce poverty. For many families, they act as a safety net during economic shocks. At the same time, heavy reliance on remittances highlights limited domestic job opportunities and exposes households to external risks.
Regional Differences in Poverty and Access to Services,
Despite national progress, geography still matters. Urban areas and central regions especially Kathmandu Valley have benefited the most from development. The incidence of poverty is higher in rural areas (24.66 per cent) than the urban areas (18.34 per cent).In contrast, provinces such as Karnali and Sudurpaschim continue to lag behind in income levels, poverty reduction, and access to essential services.
Rural households face higher poverty rates and weaker access to roads, education, and health facilities. These regional disparities underline the challenge of ensuring that development reaches every corner of the country.
Poverty Profile of Nepal (2022/23)
| Region | Head Count Rate (%) |
|---|---|
| National | 20.27 |
| Koshi | 17.19 |
| Madhesh | 22.53 |
| Bagmati | 12.59 |
| Gandaki | 11.88 |
| Lumbini | 24.35 |
| Karnali | 26.69 |
| Sudhurpaschim | 34.16 |
Conclusion
Nepal’s development story is one of resilience and gradual transformation. Poverty has fallen, literacy has risen, infrastructure has expanded, and remittances have reshaped household economies. Yet progress has not been evenly shared.
The data reminds us that growth alone is not enough. Addressing inequality across income groups, genders, and regions will be essential for building a more inclusive and sustainable future.
About This Story
This analysis is based on data from the Nepal Living Standards Survey (NLSS) conducted by the Central Bureau of Statistics (CBS), covering 1995/96–2022/23. Aggregated datasets were accessed through Open Data Nepal (ODN) to analyze long-term trends in income, consumption, education, housing, and remittances in Nepal.
